Nigeria Gas Flare Detection & Emissions Analysis Using VIIRS Satellite Data (2012–2024)
B.Sc. Statistics (First Class) · University of Ilorin · 2015–2019
Using 13 years of World Bank VIIRS satellite data (2,264 records, 57 operators), I map, analyse, and model Nigeria’s gas flaring crisis in the Niger Delta. A Random Forest model (R² = 0.77) reveals that geographic location drives 86% of flare intensity predictions. Seplat Energy has reduced its flaring by 49% since 2013, but Sapele and Oben fields remain the core targets for its Flares Out programme as it integrates the newly acquired SEPNU (formerly ExxonMobil MPNU) assets.
Abstract
Gas flaring remains one of the most visible and persistent environmental failures in Nigeria’s oil and gas sector. Nigeria is responsible for approximately 10% of global gas flaring, concentrated in the Niger Delta — a region spanning Delta, Rivers, Bayelsa, Imo, and Akwa Ibom States. Between 2012 and 2024, Nigerian operators flared 96.46 billion cubic metres (BCM) of gas, releasing an estimated 270.1 million tonnes of CO&sub2; equivalent into the atmosphere — a profound environmental and economic loss. This study draws on field-level annual data from the World Bank Global Gas Flaring Reduction Partnership (GGFR), derived from VIIRS (Visible Infrared Imaging Radiometer Suite) satellite night-fire observations, covering 57 operators across 13 years.
This project applies exploratory data analysis, geospatial mapping, operator benchmarking, and CO&sub2; estimation to characterise the structure and trajectory of Nigeria’s flaring problem. Particular analytical focus is given to Seplat Energy’s Flares Out programme — an explicit commitment to eliminate routine gas flaring across its operations in OMLs 4, 38, 40, and 41 — and to the strategic implications of the 2024 acquisition of MPNU (now SEPNU), formerly ExxonMobil’s Nigerian shallow-water subsidiary. A Random Forest regression model is deployed to identify the structural drivers of flaring intensity, providing a machine learning demonstration directly relevant to the analytical and technical competencies required by the 2026 Seplat Energy Technical Graduate Trainee Programme.
Dataset Variables
| Variable | Description | Type |
|---|---|---|
Country | Country of flare site (all Nigeria in this dataset) | Categorical |
Lat | Latitude of flare site (decimal degrees, WGS-84) | Continuous |
Lon | Longitude of flare site (decimal degrees, WGS-84) | Continuous |
bcm | Annual flare volume in billion cubic metres (BCM) | Continuous |
MMscfd | Flare volume in million standard cubic feet per day | Continuous |
Year | Observation year (2012–2024) | Integer |
Field_Type | Hydrocarbon field classification (Oil, Gas, LNG) | Categorical |
Field_Name | Name of the producing field | Categorical |
Operator | Operating company responsible for the flare site | Categorical |
Location | Operational environment (ONSHORE / OFFSHORE) | Binary categorical |
Flare_Level | VIIRS intensity classification (Small / Medium / Large) | Ordinal |
Flaring_Vol_m3 | Flare volume in million cubic metres (redundant with BCM) | Continuous |
CO2_tonnes | Derived: CO&sub2; equivalent (BCM × 2,800,000) | Continuous |
1. National Flaring Trends
Nigeria flared 9.62 BCM in 2012, declining 45% to 5.32 BCM by 2022 — driven by government regulation under the Associated Gas Framework Agreement, the NNPC/Seplat joint venture’s gas commercialisation investments, and increasing domestic gas utilisation for power generation. The 2017 spike reflects well-documented Niger Delta pipeline disruptions that curtailed gas evacuation infrastructure, forcing increased on-site flaring. However, 2023 and 2024 show an uptick to 6.48 BCM, signalling that structural barriers to full gas utilisation remain — particularly as the newly acquired SEPNU offshore assets bring additional flaring volumes under Nigerian operator management. These data provide an independent, satellite-derived verification of sector performance that is not reliant on self-reported operator disclosures.
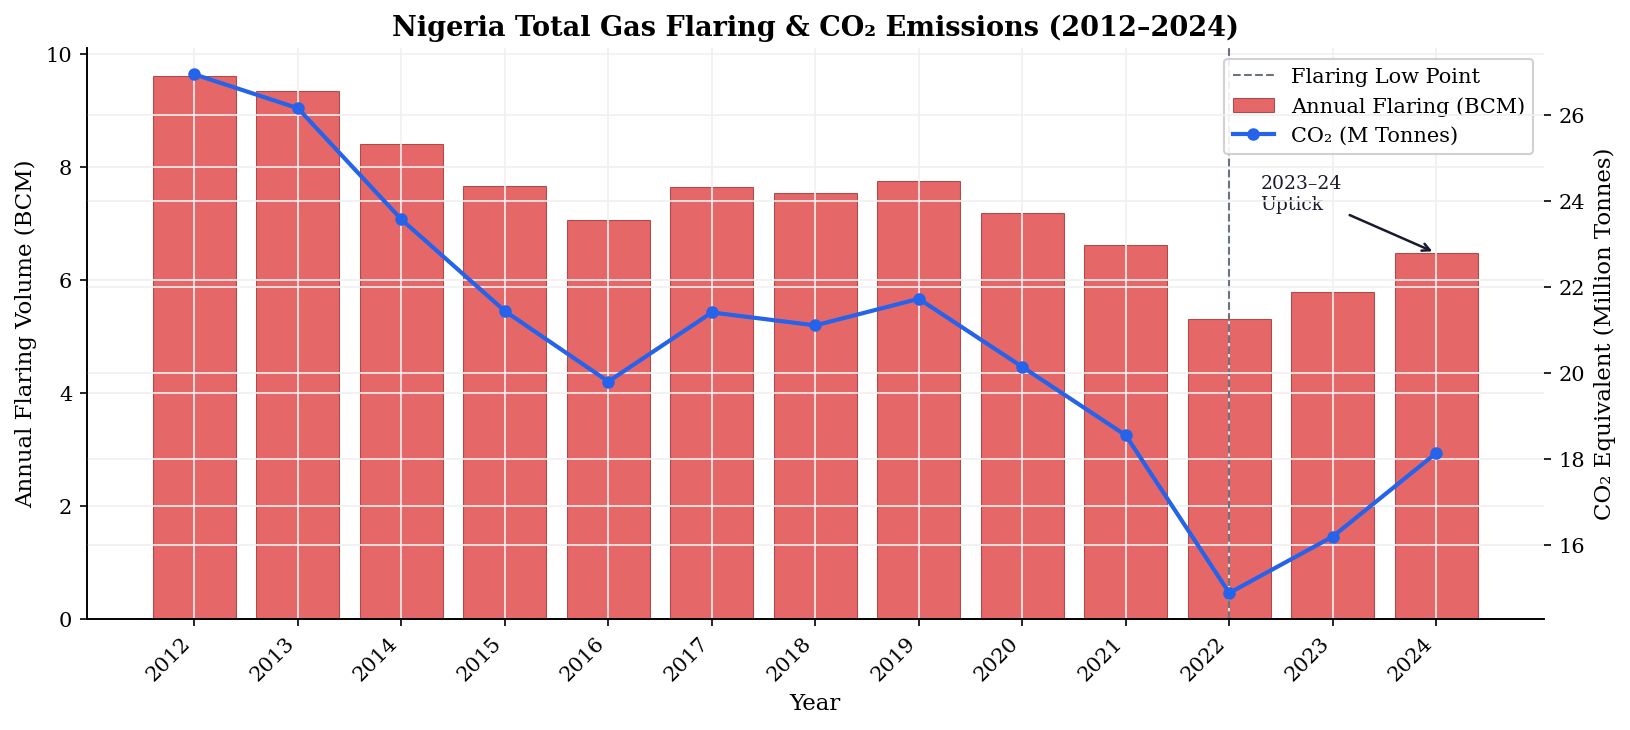
Figure 1. Nigeria total annual gas flaring volume (BCM, left axis, red bars) and CO&sub2; equivalent emissions (million tonnes, right axis, blue line) from 2012 to 2024. The dashed vertical line marks 2022, the historical low point. The 2023–2024 uptick is annotated. Data source: World Bank GGFR / VIIRS satellite observations.
Operator-level analysis reveals a highly concentrated market structure. ExxonMobil (16.53 BCM cumulative) was by far the largest single flaring entity in Nigeria over the 2012–2024 period, followed by Eni (12.94 BCM), Chevron (10.08 BCM), and Shell (8.91 BCM). These four international oil companies (IOCs) account for 50.1% of total flaring over the period. The December 2024 completion of Seplat Energy’s acquisition of MPNU (renamed SEPNU — Seplat Energy Production Nigeria Unlimited) fundamentally changes this picture: Seplat now assumes responsibility for the assets previously operated by the single largest flaring entity in the dataset. Historically, Seplat itself ranks 8th with a cumulative 3.48 BCM (for the SEPLAT Petroleum Development entity), underscoring both the scale of the integration challenge and the opportunity for the Flares Out programme to drive a step-change reduction.
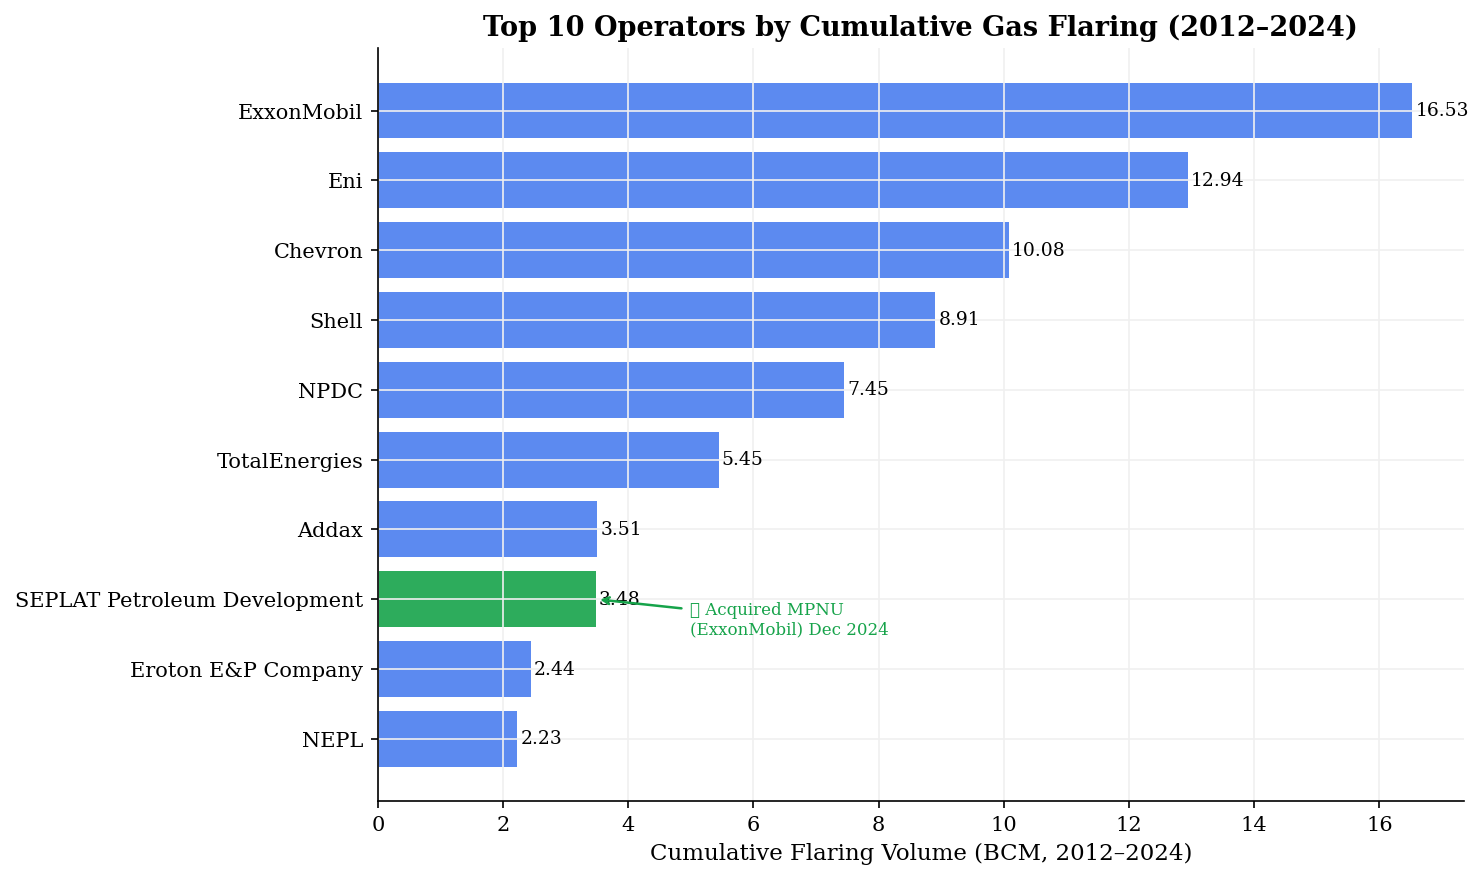
Figure 2. Top 10 Nigerian gas flaring operators by cumulative BCM, 2012–2024. Seplat Energy is highlighted in green. The annotation marks the strategic significance of the December 2024 MPNU acquisition (now SEPNU). ExxonMobil’s 16.53 BCM cumulative figure represents the flaring liability now integrated into Seplat’s portfolio.
The distribution of flaring by intensity level and operational environment reveals important structural features. Medium-classification flares dominate by volume, accounting for the majority of Nigeria’s flared gas — a pattern that reflects the prevalence of chronic, ongoing associated gas flaring at producing fields, rather than a small number of large discrete events. This has direct implications for abatement strategy: addressing medium flares through gas utilisation infrastructure (pipelines, compression, processing) yields greater cumulative reductions than eliminating episodic large flares alone. Onshore operations account for the majority of flaring by volume, though offshore flaring is proportionally significant given the smaller number of offshore fields.
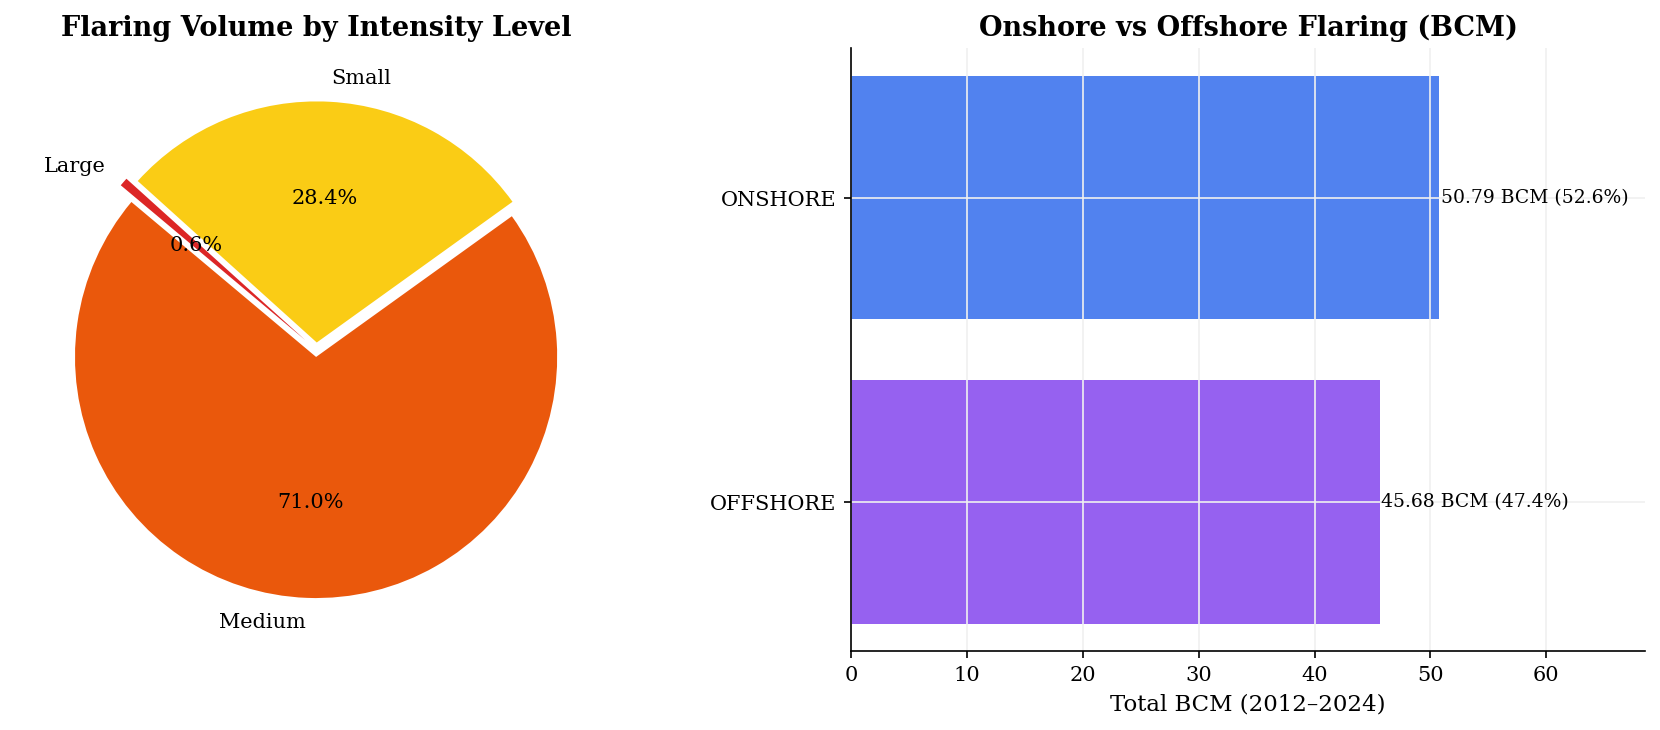
Figure 3. Left: distribution of total flaring volume (BCM) by VIIRS intensity classification (Small / Medium / Large) across 2012–2024. Right: onshore versus offshore total flaring volume with percentage share. Medium-intensity flares represent the dominant category by volume, underscoring the importance of chronic flare abatement over episodic interventions.
2. Seplat Energy — Flares Out Programme
Seplat Energy Plc, Nigeria’s leading indigenous energy company listed on the Nigerian Exchange (NGX: SEPLAT) and London Stock Exchange (LSE: SEPL), has committed to eliminating routine gas flaring across its onshore operations through the Flares Out programme. The satellite data provides independent, third-party verification of this commitment, disaggregated at the individual field level — a degree of transparency that self-reported corporate disclosures alone cannot offer.
Seplat’s peak flaring year was 2013, at 0.498 BCM. By 2024, this had declined to 0.252 BCM — a 49% absolute reduction. This decline outpaces Nigeria’s national average (45% over the same period), reflecting targeted investments including the Sapele Integrated Gas Plant (SIGP), commissioned in 2024, which diverts previously flared gas to domestic power generation. The ANOH Gas Plant (targeting 300 MMscfd, having achieved first gas in 2025 under the Assa North-Ohaji South JV between Seplat and NNPC’s subsidiary) will further accelerate flaring reduction by commercialising associated gas from OML 53. A notable rebound is visible between 2018–2020, which corresponds to production ramp-up at new fields prior to full gas infrastructure commissioning — a transient increase that is consistent with the expansion phase of the Flares Out programme timeline.
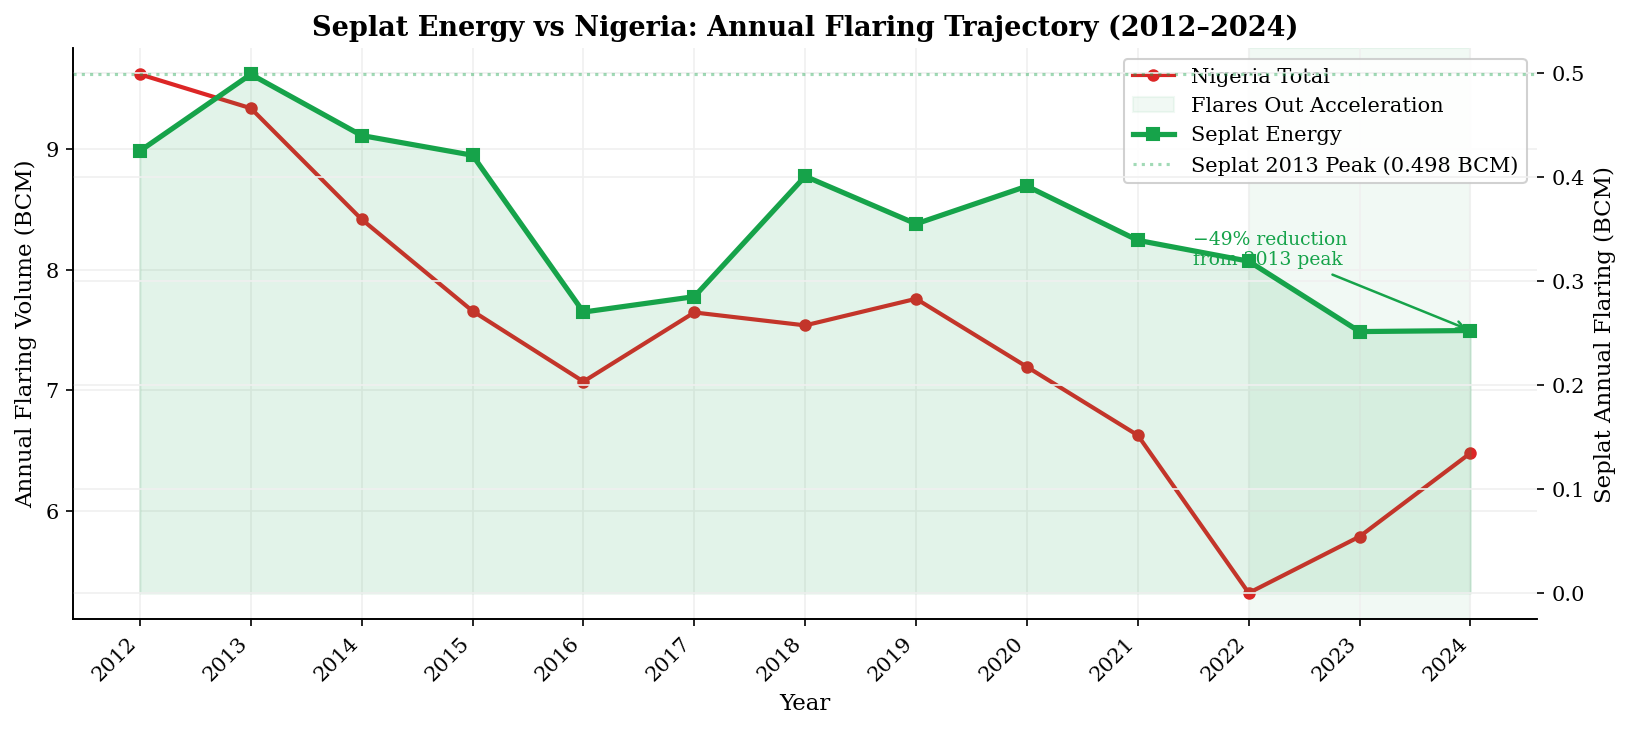
Figure 4. Seplat Energy annual flaring (BCM, right axis, green) versus Nigeria national total (BCM, left axis, red), 2012–2024. The shaded green area under the Seplat line emphasises the volume trajectory. The 2013 peak reference line and the 49% reduction annotation provide context for the Flares Out programme’s progress. The light-green background shading marks the 2022–2024 Flares Out acceleration period.
2.1 Field-Level Analysis
Sapele (37.3%, 1.733 BCM) and Oben (35.1%, 1.630 BCM) fields together account for 72.4% of Seplat’s historical flaring, concentrated in OML 38 and OML 4 respectively. Robertkiri (OML 40) contributes a further 14.4% (0.667 BCM). These three fields are the primary targets for Seplat’s ongoing flaring reduction investments and collectively account for 86.8% of cumulative flaring. The remaining fields — Idama, Amukpe, Inda, and Ubima — contribute minimally and are likely already approaching near-zero-routine-flaring status. The stacked area chart for the top three fields illustrates how Sapele and Oben have historically dominated the portfolio, with both showing measurable downward trends in the 2022–2024 period as the SIGP and gas evacuation infrastructure investments take effect.
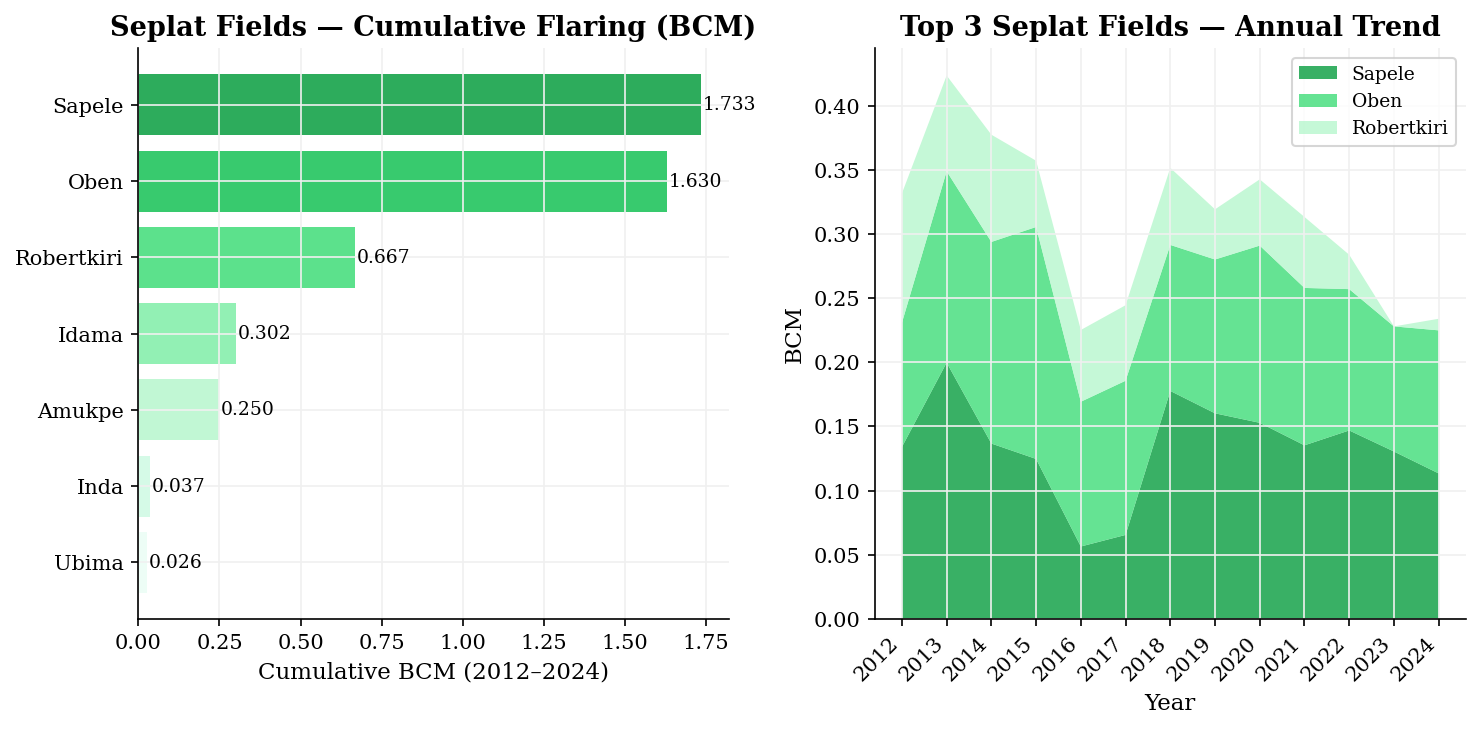
Figure 5. Left: Seplat Energy fields ranked by cumulative flaring (BCM), 2012–2024, with a green gradient from highest to lowest. Right: stacked area chart of the top three Seplat fields (Sapele, Oben, Robertkiri) showing annual BCM contributions, illustrating the dominant role of Sapele and Oben within the Flares Out programme target portfolio.
3. CO&sub2; Emissions & Climate Impact
Gas flaring in Nigeria released an estimated 270.1 million tonnes of CO&sub2; equivalent between 2012 and 2024 — a figure equivalent to the annual greenhouse gas emissions of approximately 58 million passenger vehicles. This represents a substantial and quantifiable contribution to atmospheric forcing from a single country’s oil sector. Beyond the climate cost, this volume represents enormous untapped commercial value: at prevailing LNG spot prices during the period, the 96.46 BCM flared over 13 years could conservatively have generated approximately $9–12 billion USD in revenue for Nigerian gas commercialisation channels, including domestic gas supply for power generation, LPG production, and export-grade LNG. Seplat’s Flares Out programme is therefore simultaneously an environmental commitment and a commercial strategy — converting waste gas into revenue and contributing to Nigeria’s Decade of Gas initiative.
Seplat’s CO&sub2; trajectory closely mirrors its flaring volume trend, peaking in 2013 at approximately 1,395 thousand tonnes and declining to approximately 707 thousand tonnes by 2024. The downward trend line fitted to Seplat’s annual CO&sub2; data confirms a statistically consistent reduction trajectory — an important signal for ESG investors on the London Stock Exchange and for the company’s alignment with net-zero transition pathways.
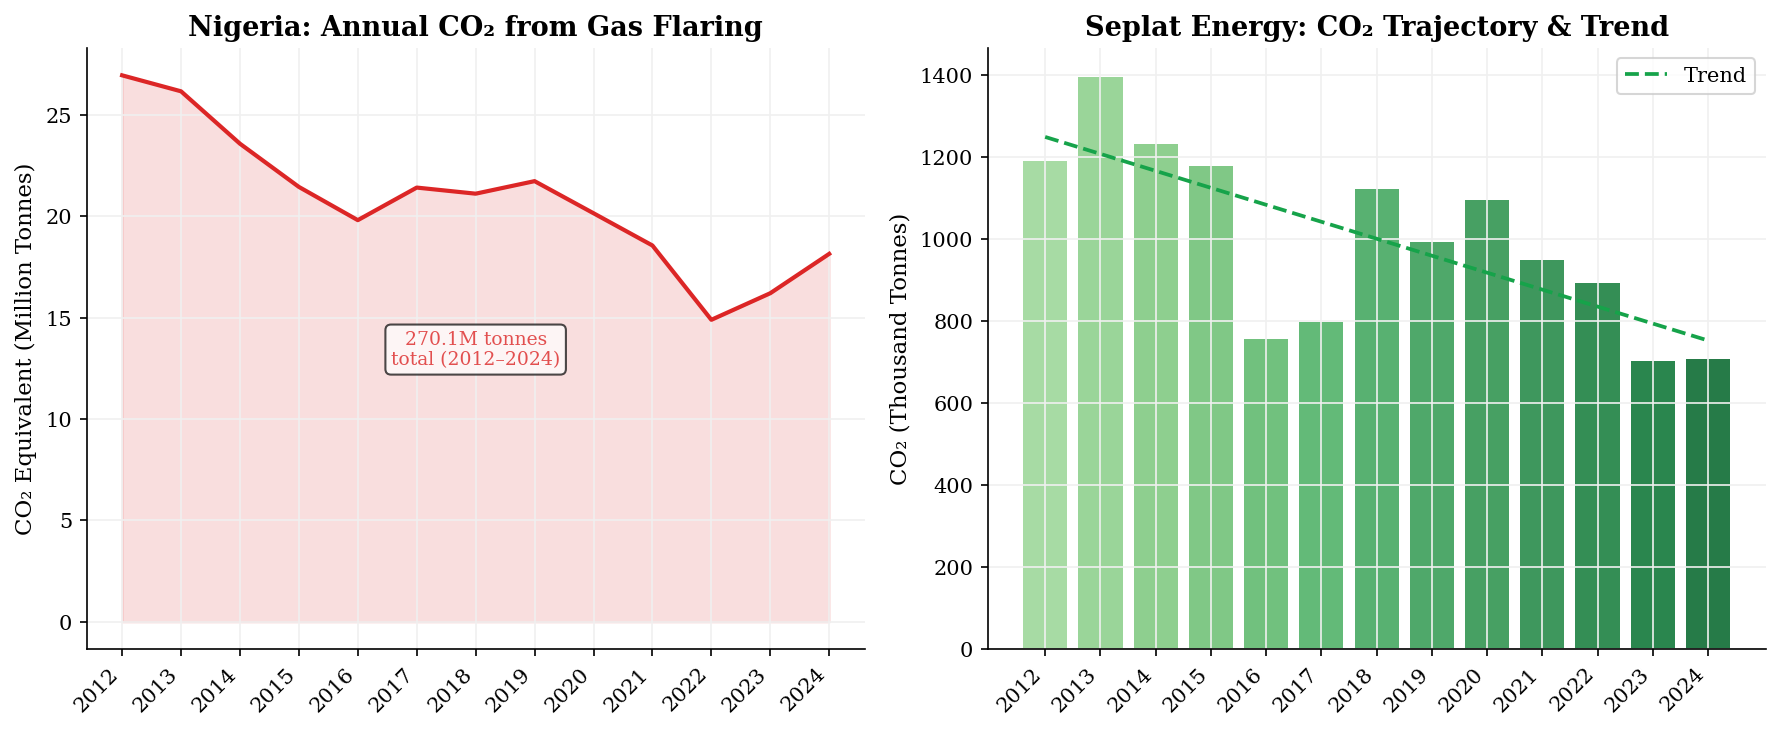
Figure 6. Left: Nigeria’s annual CO&sub2;-equivalent emissions from gas flaring (million tonnes), 2012–2024, with a cumulative total annotation. Right: Seplat Energy’s annual CO&sub2; trajectory (thousand tonnes) with a linear trend line, demonstrating a consistent downward trajectory consistent with the Flares Out programme objectives.
4. Geospatial Distribution
The Niger Delta accounts for virtually all of Nigeria’s gas flaring, concentrated in a roughly 400 km coastal zone spanning Delta, Rivers, Bayelsa, Imo, and Akwa Ibom States. The 2024 satellite map reveals that Seplat’s operational fields (Sapele, Oben, Robertkiri — within OMLs 4, 38, 40, and 41) cluster in the central-northern Niger Delta onshore zone, while major offshore flaring from ExxonMobil (now SEPNU), Chevron, and Shell occurs in the coastal and shallow-water zones. The spatial concentration of flare sites in specific geographic clusters reflects the structural relationship between oil field locations, pipeline infrastructure, and gas utilisation capacity — a relationship that the machine learning analysis in Section 5 quantifies with precision. With the SEPNU acquisition, Seplat now carries flaring responsibilities across both onshore and offshore environments for the first time, requiring an extension of the Flares Out methodology to shallow-water production operations.
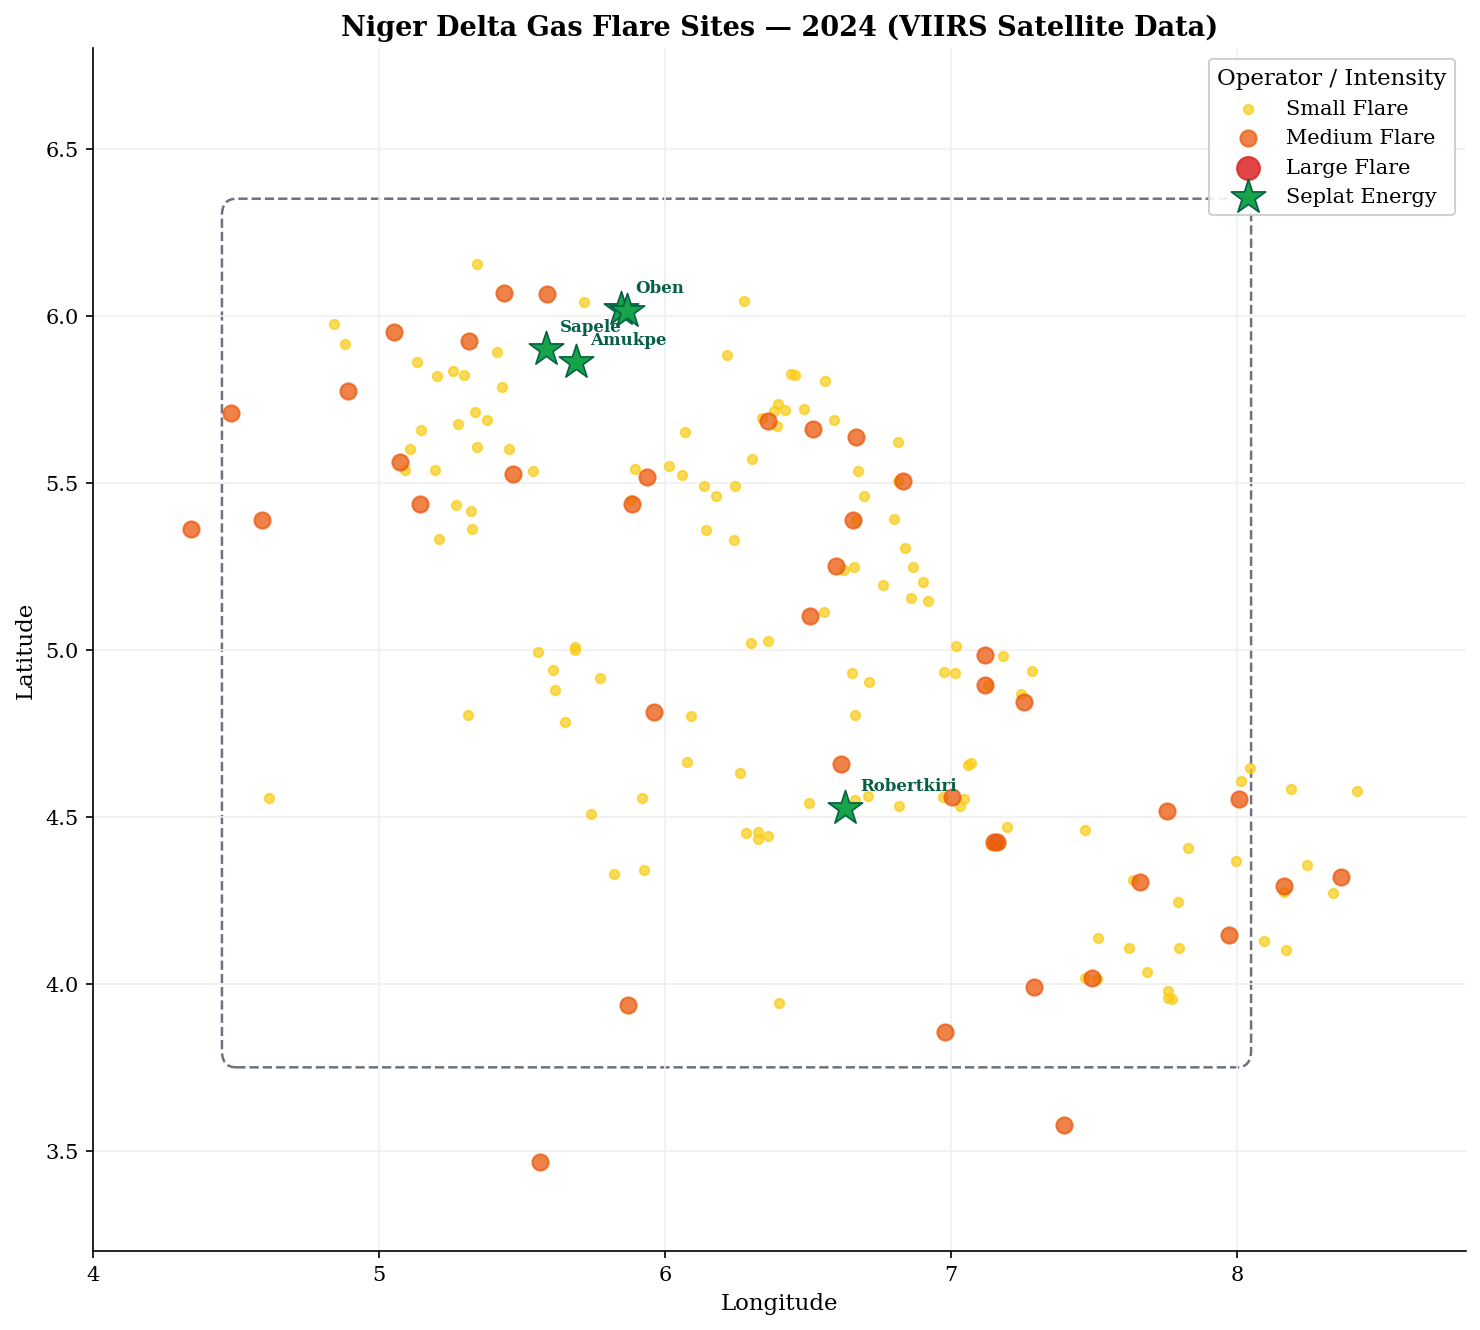
Figure 7. Geospatial distribution of all active gas flare sites in Nigeria’s Niger Delta for 2024, as detected by VIIRS satellite observations. Seplat Energy sites are marked with green stars; large, medium, and small flares by other operators are shown as red, orange, and yellow circles scaled by intensity. Seplat field labels are annotated directly on the map. The dashed rectangle outlines the core Niger Delta flaring zone. Coordinates in decimal degrees (WGS-84).
5. Machine Learning — Predictive Modelling
A Random Forest Regression model was trained on the full dataset (n = 2,264 observations) to predict individual flare site annual volume (BCM) from geographic and operational features. The model provides quantitative insight into the structural drivers of flaring intensity and demonstrates the potential for supervised machine learning to support operational decision-making, regulatory monitoring, and investment prioritisation in the oil and gas sector.
Algorithm: Random Forest Regressor — 200 estimators, max_features='sqrt', random_state=42
Features: geographic coordinates (latitude, longitude), year, location type (onshore/offshore, label-encoded), field type (oil/gas/LNG, label-encoded)
Target: annual flare volume (BCM) at individual site level
Split: 80% training (1,811 samples) / 20% held-out test (453 samples), random_state=42
Evaluation: coefficient of determination (R²) and mean absolute error (MAE) on the test set
| Metric | Value | Interpretation |
|---|---|---|
| R² Score | 0.7675 | 76.75% of variance in BCM explained by the model |
| MAE | 0.01548 BCM | Mean absolute prediction error of 15.5 million m³ per site per year |
| Training Samples | 1,811 | 80% of 2,264 total observations |
| Test Samples | 453 | 20% held-out, unseen during training |
| Estimators | 200 | Number of trees in the ensemble |
The most significant finding from the feature importance analysis is that geographic coordinates (latitude and longitude) together account for 86.3% of predictive importance — latitude contributing 43.15% and longitude contributing 43.19%. This confirms that gas flaring in Nigeria is not randomly distributed but is structurally concentrated in specific spatial clusters within the Niger Delta, reflecting the underlying geology, infrastructure, and operational history of the region. Year contributes 12.3% of importance, capturing the declining trend in flaring over the 2012–2024 period. Field type and location type (onshore/offshore) contribute less than 1.5% combined, suggesting that which company operates a field, or whether it is on- or offshore, matters far less to predicted flare volume than where that field is located geographically.
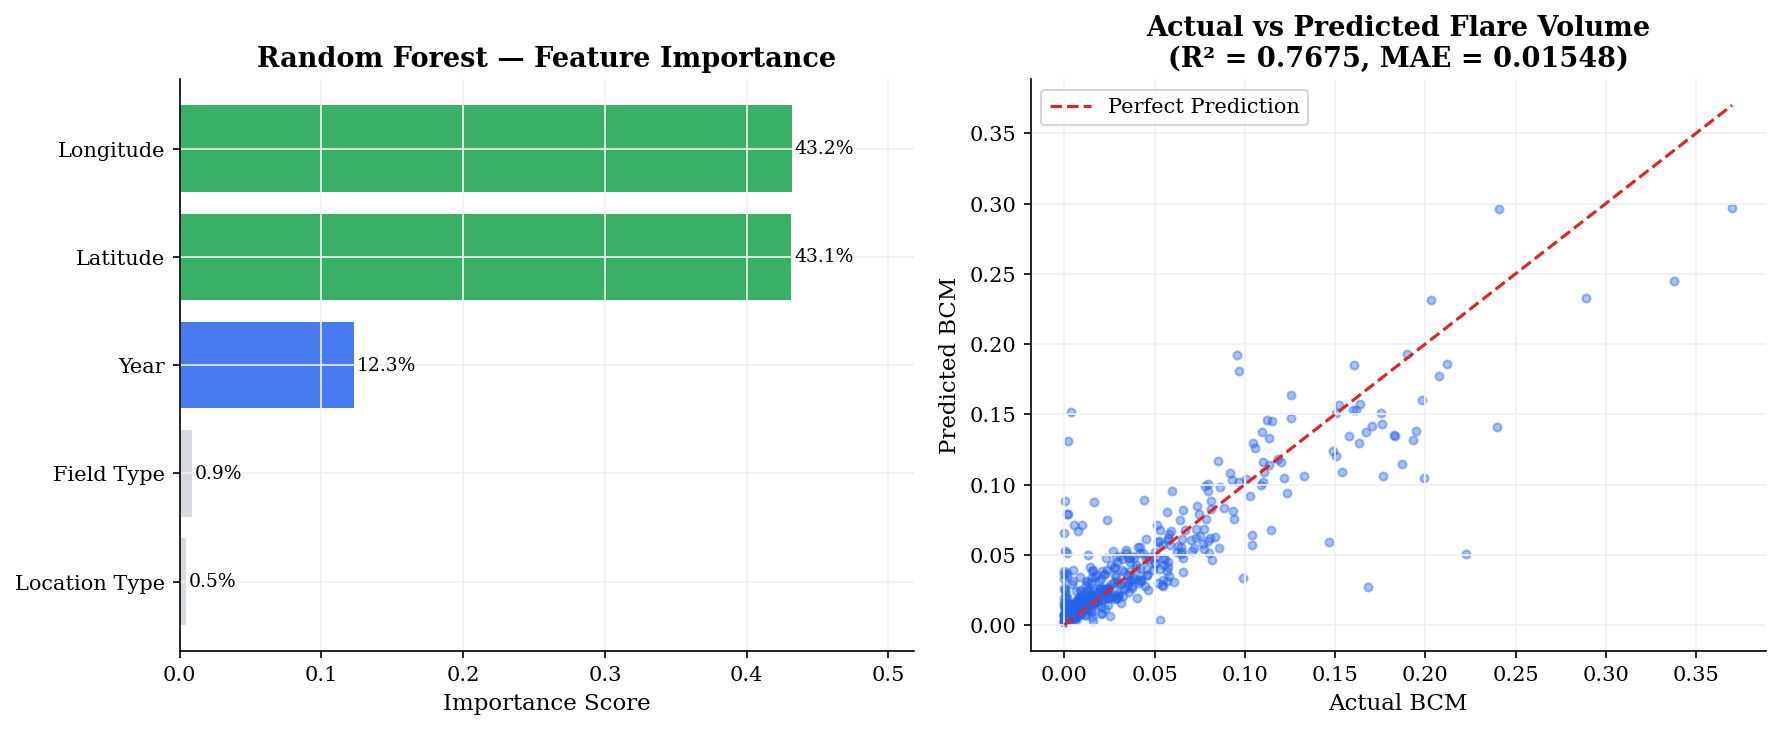
Figure 8. Left: Random Forest feature importance scores (%), confirming that geographic coordinates (latitude + longitude) dominate at 86.3%, with year contributing 12.3%. Right: scatter plot of actual versus predicted BCM values on the 20% held-out test set (n = 453), with the perfect-prediction diagonal shown in red. The model achieves R² = 0.7675 and MAE = 0.01548 BCM.
6. Key Findings & Industry Implications
The 45% reduction in national flaring from 2012 to the 2022 low point represented genuine progress, driven by regulatory pressure, gas commercialisation investment, and improved pipeline infrastructure. However, the 2023–2024 rebound to 6.48 BCM indicates that structural barriers remain. The integration of large offshore flaring portfolios (SEPNU) into the Nigerian operator base, combined with persistent infrastructure bottlenecks, means that the final reduction to near-zero routine flaring will require a qualitatively different level of capital deployment and policy enforcement than the first phase of decline.
ExxonMobil was Nigeria’s single largest gas flarer over the 2012–2024 period, with a cumulative 16.53 BCM — more than three and a half times Seplat’s own historical total. With the completion of the MPNU acquisition (now SEPNU) in December 2024, Seplat assumes operational responsibility for these shallow-water assets. Integrating SEPNU into the Flares Out programme is therefore the most consequential near-term environmental challenge — and the largest single commercial opportunity through gas monetisation — facing Seplat in 2025–2026. The scale of ExxonMobil’s historical flaring relative to Seplat’s own portfolio makes this acquisition transformative for the company’s environmental footprint.
The 49% reduction in Seplat’s flaring from its 2013 peak to 2024 is independently confirmed by VIIRS satellite observations — a methodology that is not subject to operator reporting bias or measurement uncertainty at source. The commissioning of the Sapele Integrated Gas Plant (SIGP) and progress on the ANOH Gas Project are visible as inflection points in the satellite time series. This independent verification is significant for ESG disclosures, investor confidence, and regulatory compliance reporting under the Nigerian Upstream Petroleum Regulatory Commission (NUPRC) framework.
Medium-intensity flares account for the dominant share of Nigeria’s total flared volume. This pattern indicates that the flaring problem is driven primarily by chronic, low-to-moderate associated gas flows at individual production sites — not by a small number of large, catastrophic events. Consequently, the highest-impact abatement strategy is the systematic installation of gas compression, gathering, and utilisation infrastructure at medium-flare sites, rather than focusing exclusively on eliminating visible large flares. This has direct implications for capital allocation within the Flares Out programme’s field-level investment plans.
The finding that 86.3% of the machine learning model’s predictive power derives from geographic coordinates alone has a direct practical implication: satellite-based monitoring can identify the highest-priority intervention zones with high precision, without requiring detailed operational data from individual operators. Regulators and investors can use open-access VIIRS data to independently rank flare sites by intensity, track year-on-year changes, and hold operators accountable — a significant shift in the information asymmetry that has historically limited the effectiveness of flaring regulation in Nigeria.
The 96.46 BCM flared over 2012–2024, at conservative LNG price equivalents, represents approximately $9–12 billion USD in foregone revenue for the Nigerian gas sector. At current NLNG spot prices and domestic gas tariffs, even partial monetisation of ongoing flaring through gas gathering and processing would generate material revenue streams. For Seplat, whose stated strategy centres on becoming Nigeria’s leading independent gas company, eliminating routine flaring is not merely an environmental obligation but a direct driver of revenue growth — particularly as the ANOH Gas Plant and domestic gas supply contracts for the power sector come online.
7. Methodology
- Data Source World Bank Global Gas Flaring Reduction Partnership (GGFR), VIIRS satellite-derived field-level estimates, 2012–2024. Covers all identified flare sites in Nigeria with annual BCM volumes, operator attribution, and geographic coordinates. Resolution: individual flare sites; temporal: annual aggregates.
- CO&sub2; Estimation 1 BCM of flared gas ≈ 2.8 million tonnes CO&sub2; equivalent, applying the IPCC Sixth Assessment Report (AR6) conversion factor for associated gas combustion (assuming predominantly methane with characteristic NGL composition). This factor accounts for incomplete combustion and is consistent with World Bank GGFR methodology.
-
Machine Learning
scikit-learn
RandomForestRegressor(200 estimators,max_features='sqrt',random_state=42). Categorical features (Location, Field Type) label-encoded prior to training. Evaluation metrics: coefficient of determination (R²) and mean absolute error (MAE) computed on a held-out 20% test set (random split,random_state=42). - Visualisation All figures generated with matplotlib (version 3.x) at 150 DPI for high-resolution web display. Geospatial scatter plot uses decimal-degree coordinates with manually defined Niger Delta extent bounds (lon: 4.0–8.8, lat: 3.2–6.8). No third-party chart libraries are used in the web page itself.
- Limitations VIIRS cloud cover during the Niger Delta wet season (May–October) may reduce satellite detection sensitivity, potentially underestimating flaring during peak production months. World Bank GGFR volume estimates carry an inherent uncertainty of approximately ±9.5% (Elvidge et al., 2016). Company attribution is based on field operator records and may not fully reflect complex joint venture arrangements or operatorship changes during the period.
Citation
@misc{alagbe2026nigeriaflare,
  author       = {Alagbe, Olalekan Joshua},
  title        = {Nigeria Gas Flare Detection and Emissions Analysis
                  Using VIIRS Satellite Data (2012--2024)},
  year         = {2026},
  howpublished = {GitHub Pages,
                  \url{https://OlalekanAlagbe.github.io/nigeria-flare-analysis/}},
  note         = {Data Science Portfolio Project; aligned with
                  Seplat Energy 2026 Technical Graduate Trainee Programme.
                  Data: World Bank GGFR / VIIRS satellite observations.}
}